Political Calculations has tracked the price of a can of Campbell's Tomato Soup over the past 126 years. It's proved to be a pretty accurate bellwether of inflation. Its latest calculation is not comforting.
(Click the image to be taken to a larger view at Political Calculations)
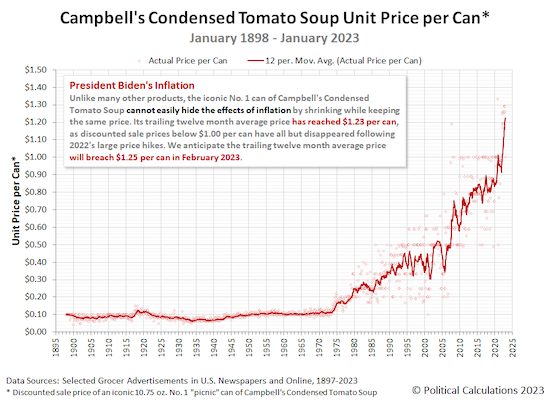
Political Calculations has tracked the price history of Campbell's Condensed Tomato Soup over the past 126 years because of its remarkable consistency as an identifiable product over time. In fact, if you had a time machine and could travel to nearly any point in time from January 1898 to the present, you could likely find a 10.75 ounce size (Number 1) can of Campbell's condensed tomato soup stocked for sale in American grocery stores.
That long-running consistency makes Campbell's Condensed Tomato Soup an ideal product to follow to understand how inflation has affected American consumers through its history.
In January 2023, we find the prevailing average sale price for this food product over the past 12 months is $1.23 per can. That figure has risen by over 29% from the trailing 12 month average of $0.95 per can we recorded in January 2022.
There's more at the link. Recommended reading.
You'll note the relatively steady price progression from 1898 until the early 1970's. From then onward, it's been a steady upward progression. Why, you ask? It's simple. President Nixon took the USA off the gold standard, and exited the Bretton Woods system, in 1971. Since then, the dollar has steadily lost its buying power. It's not that tomato soup has become more expensive: it's that the dollar is that much weaker today than it was then. Food - in this case, soup - for thought.
(A tip o' the hat to reader Jon T. for sending me the link.)
Peter
10 comments:
In early 2022 I was paying $1.28 for a 10.75oz can of tomato soup at Wally. Dollar Tree was selling a 13.8oz can of tomato soup (both Campbell's) for $1.00. I buy all my soups now at Dollar Tree. I've always been a 'it pays to watch the pennies' person.
Keep in mind the cans are also smaller now,not 303 size anymore.
Another way to think about it, a gallon of gas cost a silver quarter in 1964. Today that quarter, the silver one, will buy two gallons of gas. What would you be better off having, the dollars or that quarter?
Food prices are crazy. Last time I was at Costco, I spent $900.00 on food with a focus on frozen meat and chicken. I haven't been since November and am going there tomorrow. I'll pay with currency - Full faith and credit of the United States.
"Actual price per can" is spring-loaded to the B.S. setting, and stems purely from economic laziness.
Find a graph in constant dollars per ounce, from any point in time, and give a holler.
That graph is simply a measure of absolute devaluation of fiatbux, and tells us next to nothing about the real price of a given commodity, and wholly ignore any "shrinkflation" from changing can sizes.
GI-GO.
Aesop: That graph is specifically the 10.75 oz can over the entire time cycle. No shrinkflation, no changing package size, constant dollars per 10.75 oz. If you want constant dollars per ounce just divide by 10.75.
There’s no shrinkflation here. The “can” whose price we’ve tracked is the iconic Number 1 size can that Campbell has continuously produced and sold condensed tomato soup in since January 1898. The “actual price per can” is just that, taken from newspaper advertisements for grocers selling them at often discounted prices.
In Nixon's second inaugural address of 1972, he boasted that "We have now learned how to manage a modern economy."
Don in Oregon
@Who Struck John,
Evidently the concept of inflation, and the meaning of "constant dollars" is foreign to your understanding.
Unless you think a dime from 1900 and $1.20 from 2023 have commensurate values.
Google is your friend.
Using constant 1900 dollars, the price of a can of soup is now roughly seven times higher today than then, not 12 times higher. But that's not as dramatic, is it?
It's the $1.20 that is now more worthless.
And they're hiding that half that cost increase is naked devaluation of the dollar.
Most of the rest is attributable to labor prices and material and manufacturing costs.
That the graph hides that reality is precisely why it's worthless as a conveyor of actual information, because either like you, the graph maker doesn't understand currency devaluation, and the resultant inflation from it alone.
Or else they do, and they're lying with a graph to hide the reality on purpose.
Either way, it's dishonest.
The only difference is incompetence as a motive, vs. actual malice.
(For bonus points, the price started climbing from a span-low record of 7¢/can in 1933, and then sharply spiked again after 1973. See if you can guess what might have happened around each of those eras to cause that to happen.)
@Aesop, that's what Peter said, and I quote, "You'll note the relatively steady price progression from 1898 until the early 1970's. From then onward, it's been a steady upward progression. Why, you ask? It's simple. President Nixon took the USA off the gold standard, and exited the Bretton Woods system, in 1971. Since then, the dollar has steadily lost its buying power. It's not that tomato soup has become more expensive: it's that the dollar is that much weaker today than it was then."
He even highlighted what I put in bold.
Post a Comment